

What is ABC analysis in Inventory management?
To manage a maze of inventory more efficiently, businesses need to prioritize items that are most essential to its success. An ABC analysis is a technique you can use to identify your

How can dealerships cash-in beyond just a one-time sale or service?
Traditional methods to sell a car has been working for many years. But in this time and age where customer needs and demands are ever changing, access to competitive digital retailers and

Foundational Vectors for Building a Robust Analytics Framework
The analytics landscape continues to evolve rapidly, and businesses must align their strategies to stay competitive. At NRoot Labs, we believe that a strong analytics foundation rests on a few critical vectors.
Auto dealer’s road to sustainability with effective burn rate analysis!
The automotive industry is already at the cusp of changes! Dealerships are looking at innovative ways to retain customers while also improving their bottom line. Some of the most popular schemes being

From Instincts to Insights: The Shift to Data-Driven Leadership
In a world where data drives everything, making decisions based purely on gut instincts might seem bold, but it often means overlooking key insights and missing out on opportunities. Gut-based strategies, shaped

The Power of Connected Data in the Automotive Industry
In today’s dynamic business landscape, enterprises increasingly rely on a diverse range of specialized applications to address their unique needs. By integrating data from these multiple systems, analytics solutions can deliver unified,
What is ABC analysis in Inventory management?
To manage a maze of inventory more efficiently, businesses need to prioritize items that are most essential to its success. An ABC analysis is a technique you can use to identify your best and worst performing inventory over a certain period or even a season. It gives businesses greater inventory
How can dealerships cash-in beyond just a one-time sale or service?
Traditional methods to sell a car has been working for many years. But in this time and age where customer needs and demands are ever changing, access to competitive digital retailers and supply-demand makes it challenging to keep up with the dynamic market. When a customer walks into an auto
Foundational Vectors for Building a Robust Analytics Framework
The analytics landscape continues to evolve rapidly, and businesses must align their strategies to stay competitive. At NRoot Labs, we believe that a strong analytics foundation rests on a few critical vectors. These vectors are interdependent and provide the scaffolding for a data-driven organization. Below, we help outline some key
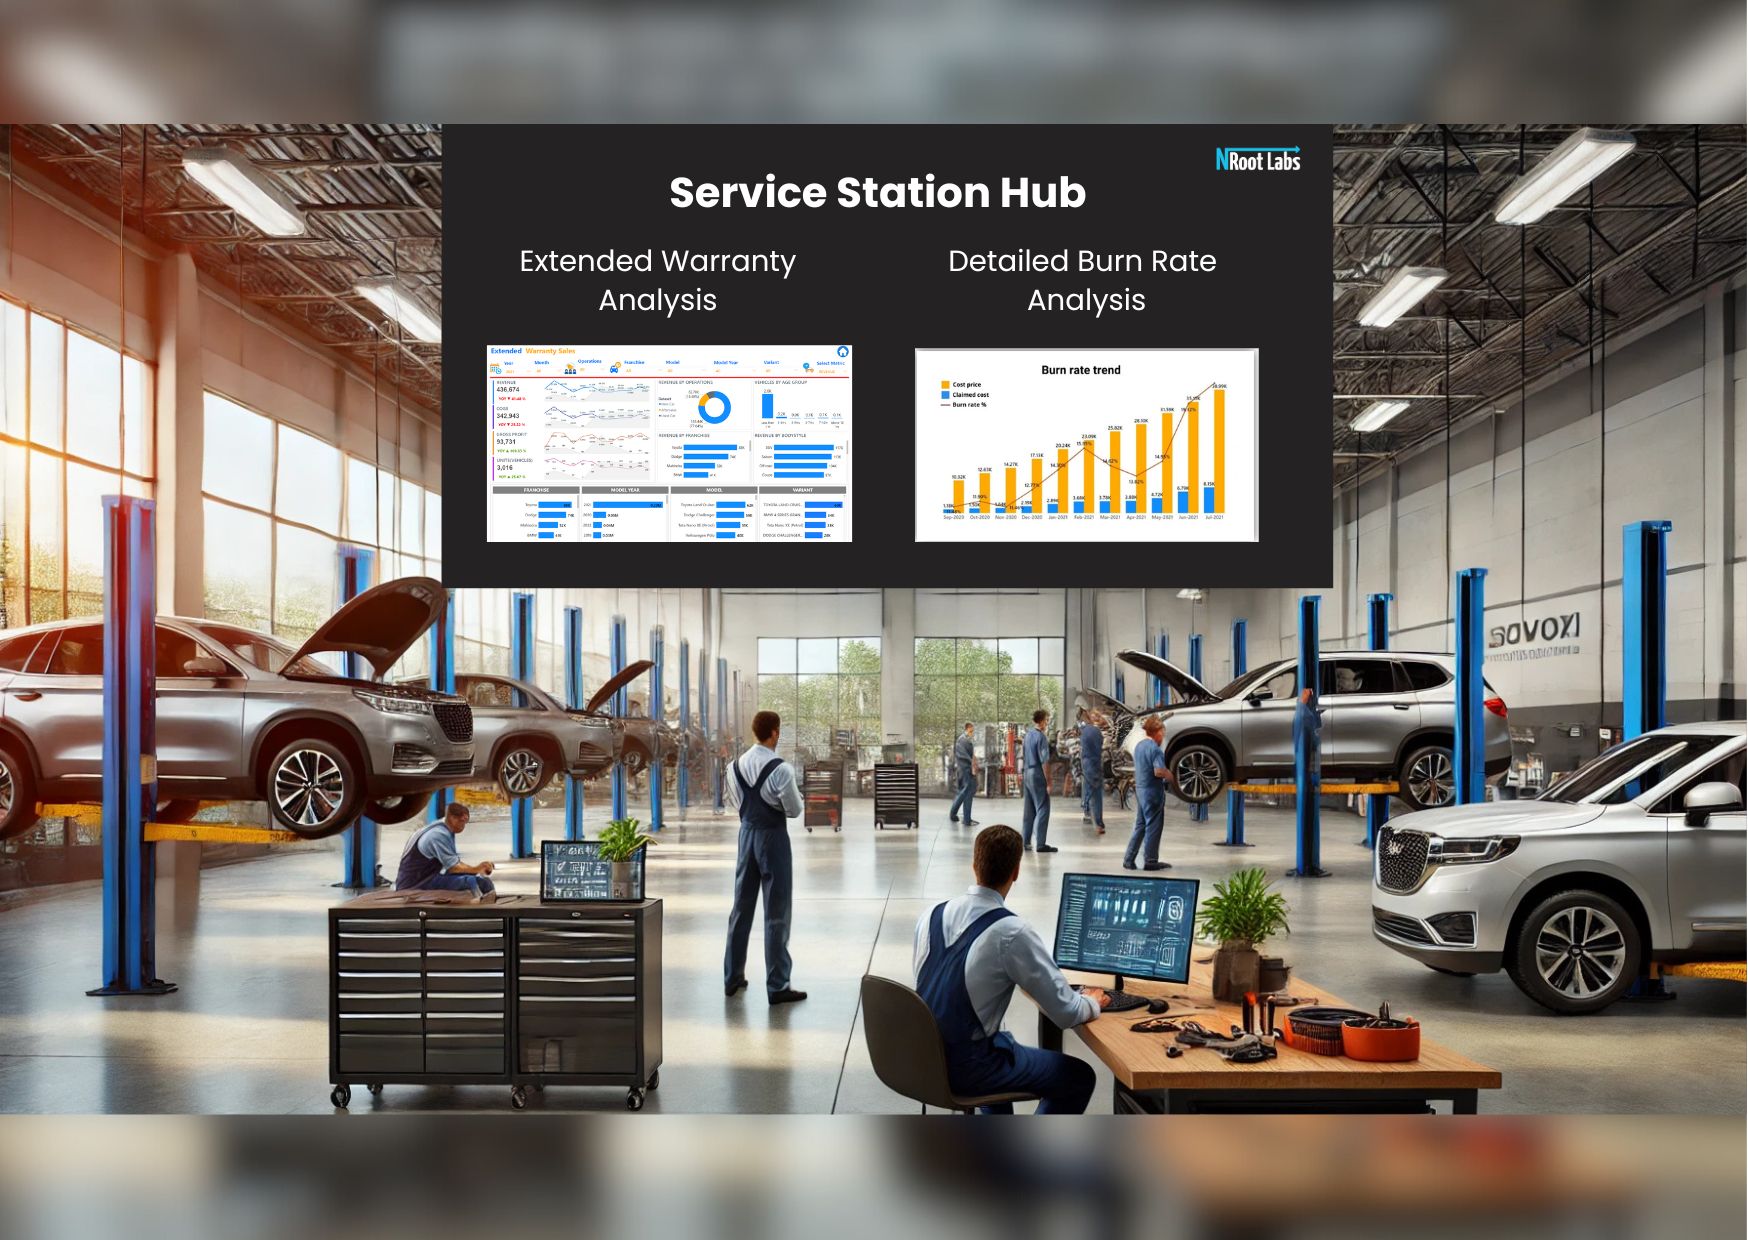
Auto dealer’s road to sustainability with effective burn rate analysis!
The automotive industry is already at the cusp of changes! Dealerships are looking at innovative ways to retain customers while also improving their bottom line. Some of the most popular schemes being applied are up-sell & cross-sell such as “extended warranty” and “service contracts” respectively. These ensure dealerships “lock-in” customers
From Instincts to Insights: The Shift to Data-Driven Leadership
In a world where data drives everything, making decisions based purely on gut instincts might seem bold, but it often means overlooking key insights and missing out on opportunities. Gut-based strategies, shaped by intuition and past experiences, can yield quick wins but lack the depth, reliability, and foresight needed for
The Power of Connected Data in the Automotive Industry
In today’s dynamic business landscape, enterprises increasingly rely on a diverse range of specialized applications to address their unique needs. By integrating data from these multiple systems, analytics solutions can deliver unified, comprehensive analysis that drives informed and strategic decision-making. This is especially true in the automotive industry, where a
What is ABC analysis in Inventory management?

To manage a maze of inventory more efficiently, businesses need to prioritize items that are most essential to its success. An ABC analysis is a technique you can use to identify your best and worst performing inventory over a certain period or even a season. It gives businesses greater inventory control and helps reduce costs.
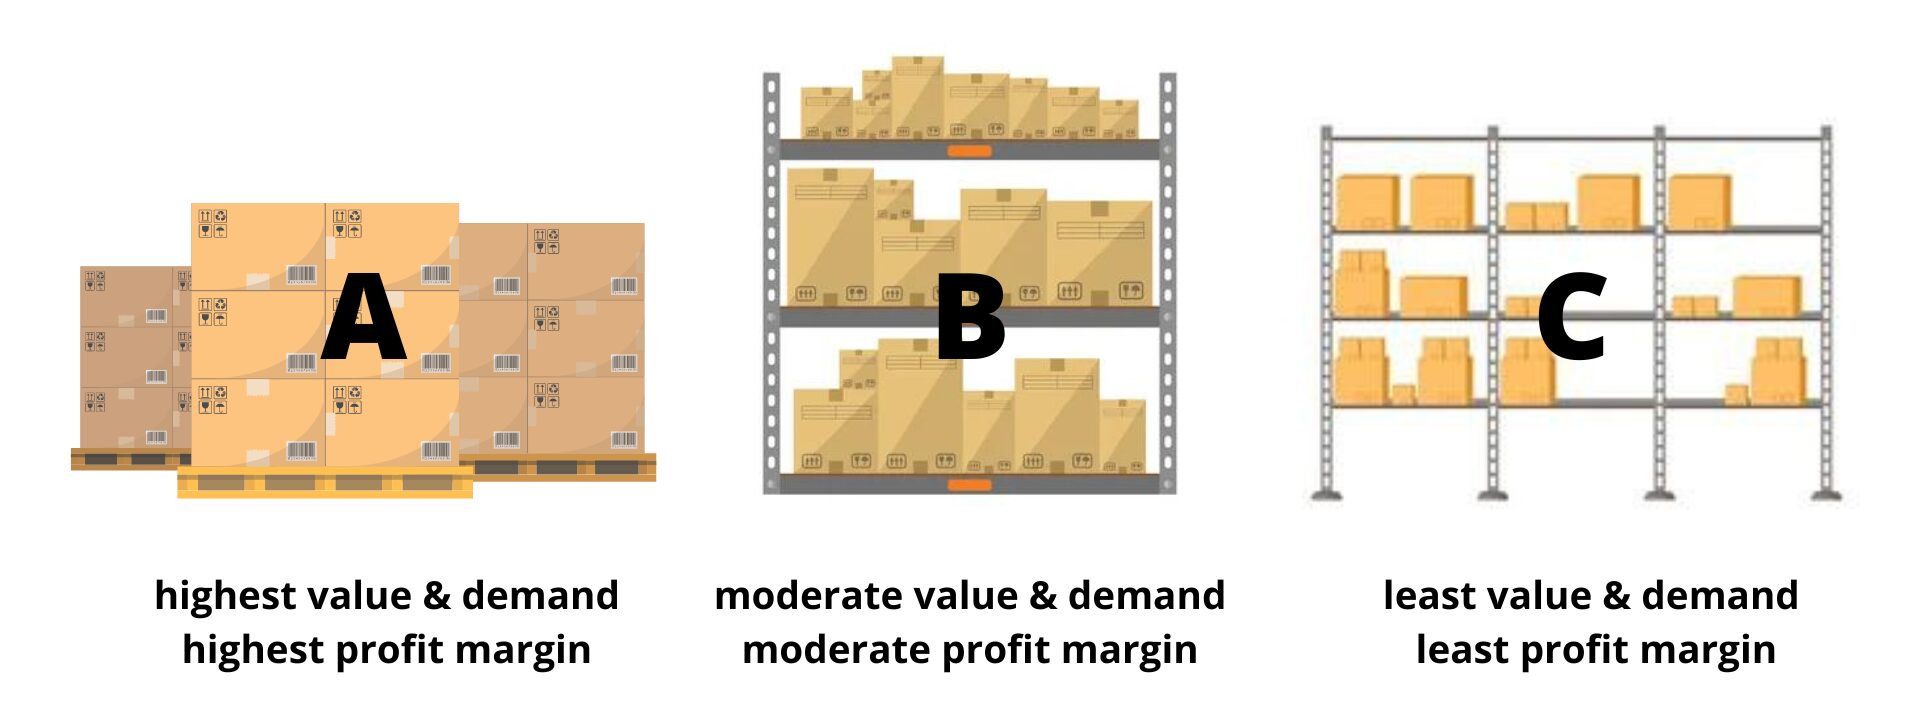
You’ve probably heard of the ’80/20 rule’ (also known as the Pareto Principle). This rule also applies to inventory management, where 80% of a company’s annual sales value comes from 20% of its items!
To put simply, we group the inventory into three buckets.
But do auto-dealers have a clarity on the pattern of product sales? Or are they aware if a certain product was sold more during a particular season? How do inventory stakeholders know which product is completely obsolete this year?
Well, the good news is, for legacy systems like Autoline system (and other popular ERPs) does have a “re-ordering category” that categorizes the inventory based on the volume of sales made. However, the system is fairly accurate, rigid and ignores seasonality. The analysis must be dynamic and take into consideration seasonality for the previous 365 days to help stock the right supplies in the inventory. Inventory managers and business users can utilize our dynamic matrix to evaluate product performance, market demand, consumption trends, avoid stocking up on rarely used products, and make well-informed decisions using the past 365 days’ worth of data.
With a right solution in hand, auto retailers can refine operational processes in inventory management which ultimately helps businesses control their costs, avoid obsolete inventory thus improving their inventory turnover rate!
We at NRoot Labs, specialize in comprehensive BI solutions. As a technology-neutral company, our team of BI consultants excels in delivering business solutions that leverage actionable insights supported by business data. Our commitment to understanding the complexities of business processes enables us to provide enhanced BI solutions for our clients.