
19 May

WHETHER YOU’RE A FAN OF MICROSOFT OR NOT, MICROSOFT POWER BI IS WORTH CONSIDERING IF YOU’RE SEARCHING FOR A BUSINESS INTELLIGENCE SOLUTION.
Microsoft under the leadership of Satya Nadella has brought in fresh make over of Microsoft, and when it comes to Business Intelligence, the changes brought about under the leadership of James Phillips needs to be specially mentioned. Business intelligence (BI) delivers critical performance analytics and insights to workers, empowering them to make faster and better business decisions. However, enterprise-wide penetration of BI is still surprisingly low. This is partially due to the misperceptions that business intelligence is costly, difficult to use and deploy, and slow to deliver real business value. “Self-service BI” is shattering these perceptions. It delivers low-cost, rapidly deployed decision-support, enabling any worker, regardless of job role, geographic location or department, to work from a reliable and up-to-date set of data, presented in a context and detail level relevant to job role and appropriate to data access privileges. This definition serves as a useful discussion point to highlight how Power BI can help your organisation to achieve the objectives of self-service BI and realise its benefits.
QUICK DEPLOYMENT
Power BI is tightly integrated with Microsoft’s other BI products and Excel, as well as having built-in connectors to external data sources and it empowers authorised users to rapidly set up new data connections and create new analysis reports. Power BI is a full-stack solution that includes data loading, data modelling, metrics, reporting and distribution. It can take the source data, and perform in-process data modelling relatively easily as well as a & As improvements are made providing an easy to use and powerful user interface for analytics and reporting.
Agile process to build new data models:It is the time it takes an organisation to create the required BI sematic layers that determines how agile or responsive it is. and with Power BI, you get a Full-Stack BI. It may come as a surprise to some, but Power BI can – with a little application – become a full-stack BI solution. This is because even though it is a single tool, it lets you carry out the key steps in a BI process. The table below lets you compare Power BI with the SQL Server BI stack:
Clearly, Power BI will let you do nearly everything that you can do using the traditional SQL Server BI toolkit. Power Query queries extend the scope of the data sources further to include Azure data services, OData feeds, web pages, web services, and SaaS applications. You can design, build, and deploy self-service BI solutions by creating Power BI reports from datasets, connecting to tabular models.
POWER BI WILL INGEST DATA FROM VIRTUALLY ANY SOURCE
Connects directly to source data and Uses tabular models to integrate different data sources: Microsoft Power BI connects to most types of on-premise databases and they have a large and growing list of cloud-based connection options as well. Power BI has tightly integrated support for tabular models, Power Query queries and third party data sources. Collectively these provide access to all the data sources your users will need and covers relational, multidimensional, structured, or semi-structured data from on-premises, cloud, or web data sources. The easiest way to consolidate diverse data sources is to develop tabular models and Power Query queries. When data is stored in a tabular model then the underlying queries to the original source data are maintained so data refreshes can be scheduled easily.
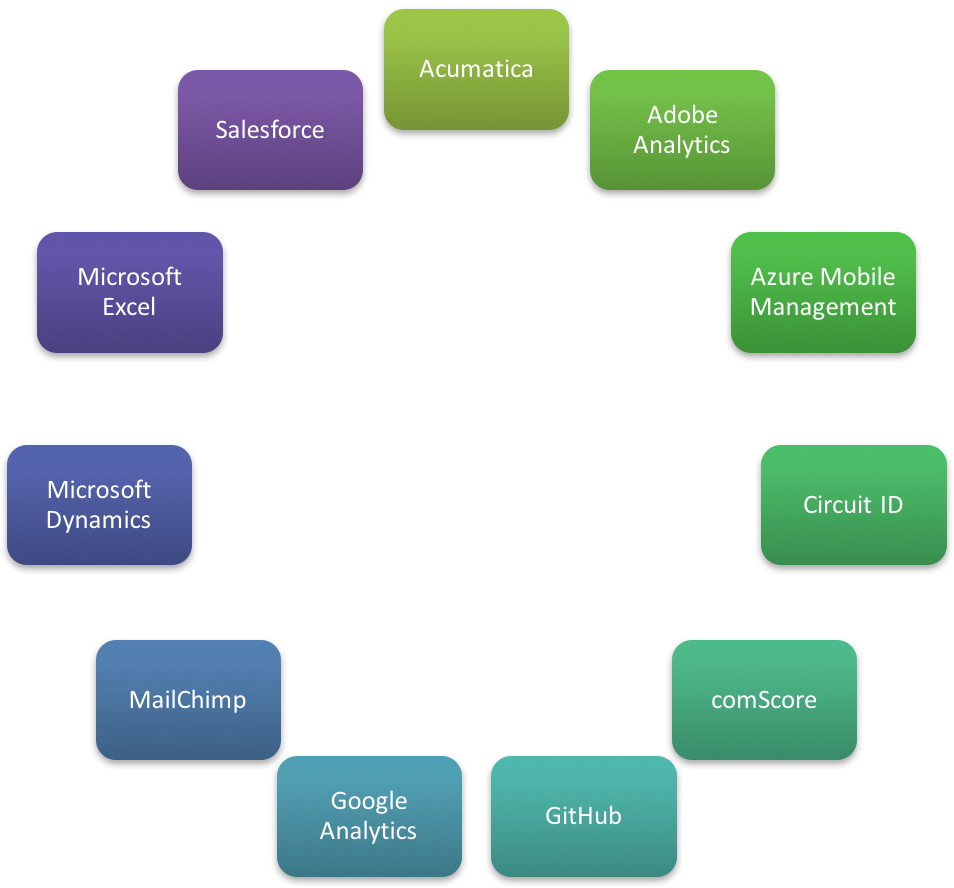
Unlimited access to in-cloud and on-premise data: Power BI gathers and stores all your cloud and on-premise info in a centralized location that you can access anytime, anywhere. You can also make use of pre-packaged content packs and built-in connectors to streamline import of your data from apps such as:
SIMPLE, CUSTOMIZABLE AND COLLABORATIVE VISUALIZATIONS
Microsoft has built a brand new HTML 5 compliant visualisation engine that is simply awesome. Everything (virtually everything) will slice and dice and cross filter everything else. Anyone that can create a chart in Excel can create a chart in Power BI (and probably some people that can’t create a chart in Excel too for that matter). You don’t need a specialised IT report writer to create every new report for the business.
Making data more comprehensible:Power BI users can create custom visuals and use them in dashboards and reports. The number of visualizations is growing, however currently, visualizations include:
![]()
Sharing Data Insights: Analysts can utilize a free-form canvas for drag-and-drop data navigation as well as a vast library of interactive visualizations, easy report creation, and fast publishing. As Power BI is part of Microsoft’s set of business apps, it offers seamless integration with popular Microsoft software systems such as SQL Server, Azure, and Excel. PowerBI service BI takes this further and allows data insights uncovered by individuals, who have explored the data, to collaborate with colleagues-by sharing your personalised dashboards or by taking snapshots of individual reports and emailing them from within the Power BI apps.
Open source Visualizations: PowerBI allows you to share its visualisation source code so that any capable developer can develop their own visualisations and share them with the community. Developers can either copy an existing visual and extend it, or they can start from scratch and build something completely new.
EASY TO USE
Minimal IT Support: Power BI is self-service BI at best. Microsoft has brought the rigour and structure from SQL Server Analysis Services into this product to ensure that it is a Self Service BI Tool with Enterprise strength features, including row level security, active directory integration etc while it is still familiar enough to Excel users that they can and will embrace it. Power BI tools can significantly reduce the learning curve for new users because report and dashboards have a simple and consistent interface that will already be familiar to many Excel users of Power View or Pivot Tables.
Augment data models with key performance indicators: A user can just drag data fields onto a visualisation within Power BI and it will intelligently interpret the data and decide how best to represent it. Power BI is made to interpret how fields are related, what type of data they contain, and whether they represent aggregations, calculations, unique values, geography fields, or hierarchies. The metadata is derived from the underlying data model can be enhanced with calculations, measures, KPIs, and perspectives (subsets of the source data), all defined using a sophisticated formula language called Data Analysis Expressions (DAX).
To streamline the experience even further, users can inquire the data and build visualisations from the results by using the natural language capability and just typing questions.
POWER BI IS CHEAP!
Because users can get up to speed quickly and require little to no training, support costs with self-service BI are significantly lower than they are with more complex BI solutions. If you implement SaaS-based self-service BI, you can also recover direct server investments and evolving maintenance costs with a convenient monthly subscription. Also, self-service BI platforms scale seamlessly so that as adoption increases, additional server capability can be added without disrupting access or requiring significant IT resources. In marked contrast to traditional enterprise BI solutions, self-service BI tools don’t require either a data warehouse or the associated database licensing costs. This alone cuts down months if not years off of BI project timelines and it eliminates sizable expense. Power BI is free to try and indeed free to use as long as you want. If you want to take advantage of more of the enterprise features including controlled sharing of data, automatic refreshes using gateways etc. then you have to pay – wait for it – a whole US$9.99 per month per user. It is enough to give the competition a run for their money!
1 GB data capacity limit Author content Consume curated content packs for services like Dynamics, Salesforce, and Google Analytics Create, view, and share personal dashboards and reports Data exploration Import data and reports from Excel, CSV and Power BI Desktop files Native apps for iOS, Windows, and Android Publish to web
$9.99 / user / month All Power BI Plan features, plus Access on-premises data using the Data Connectivity Gateways (Personal and Data Management) Collaborate with your team using Office 365 Groups in Power BI Consume live data sources with full interactivity Create, publish, and view organizational content packs Manage access control and sharing through Active Directory groups Shared data queries through the Data Catalogue
Power BI is offered in three different plans, with a cost sheet showing the high-level features of each plan here, so you can decide which option works best for your organization.
The Power BI service is on a continuous release cycle. As improvements are made, they are released into the cloud service. You can experience parallel improvements to the mobile apps and to Power BI Desktop. The pace of their release cycles s still incredible. Quite literally, today’s biggest complaint can disappear when you wake up tomorrow morning.
I highly endorse it and urge you to try for yourself and make your own evaluation. Have you used Power BI before? What was your observation?
NRoot Labs has tremendous experience and has the resources to architect and deploy comprehensive BI solutions with Microsoft’s technology stack on-premise or in the cloud. Contact us to learn how you can integrate Power BI into your overall BI strategy.